civpy.survey.TIN.plot_surface_2d
-
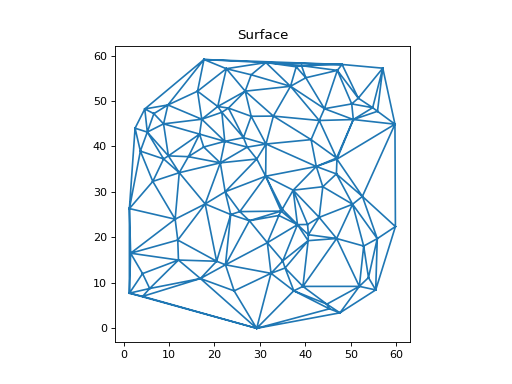
TIN.plot_surface_2d(self, ax=None)[source]¶ Plots a the triangulation in 2D.
Parameters: - ax :
matplotlib.axes.Axes The axes to which the plot will be added. If None, a new figure and axes will be created.
Examples
# tin_ex2.py
import numpy as np
from civpy.survey import TIN

np.random.seed(32343)
x = np.random.uniform(0, 60, 100)
y = np.random.uniform(0, 60, 100)
z = np.random.uniform(0, 20, 100)

p = np.column_stack([x, y, z])

t = TIN('Surface', p, grid=10)

t.plot_surface_2d()
(Source code, png, hires.png, pdf)
- ax :