civpy.survey.TIN.plot_surface_3d
-
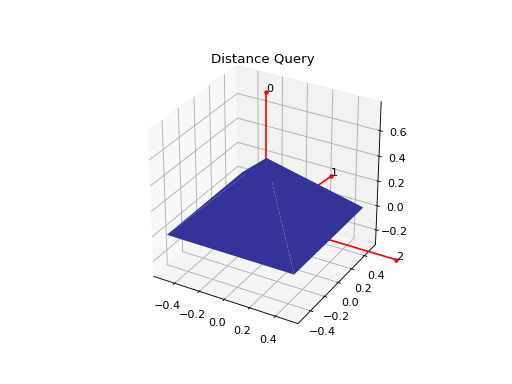
TIN.plot_surface_3d(self, ax=None, cmap='terrain')[source]¶ Plots a the rendered TIN surface in 3D
Parameters: - ax :
matplotlib.axes.Axes The axes to which the plot will be added. If None, a new figure and axes will be created.
- cmap : str
The name of the color map to use.
Examples
# tin_ex1.py
import numpy as np
from civpy.survey import TIN

# TIN points
p = np.array([
    (-0.5, -0.5,   0),
    ( 0.5, -0.5,   0),
    ( 0.5,  0.5,   0),
    (-0.5,  0.5,   0),
    (   0,    0, 0.5)
])

t = TIN('Distance Query', p)
ax = t.plot_surface_3d()

# Query points
q = np.array([
    (  0, 0,   1),
    (0.5, 0, 0.5),
    (  1, 0,   0)
])

ax.plot(q[:,0], q[:,1], q[:,2], 'r.')

for i, x in enumerate(q):
    _, r = t.query_distances(x, 5)
    r = np.column_stack([x, r[0]])
    ax.text(x[0], x[1], x[2], i)
    ax.plot(r[0], r[1], r[2], 'r-')
- ax :