civpy.survey.TIN.plot_contour_2d
-
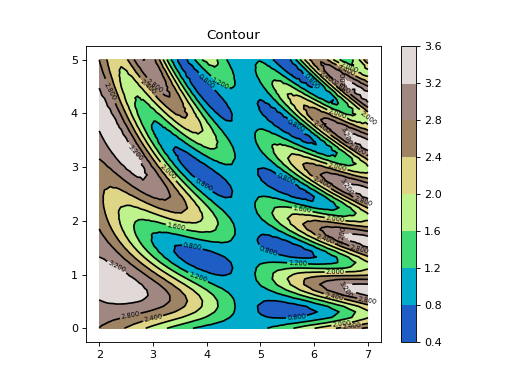
TIN.plot_contour_2d(self, ax=None, cmap='terrain')[source]¶ Plots a the rendered TIN surface in 3D
Parameters: - ax :
matplotlib.axes.Axes The axes to which the plot will be added. If None, a new figure and axes will be created.
- cmap : str
The name of the color map to use.
Examples
# tin_ex2.py
import numpy as np
from civpy.survey import TIN

# Generate grid coordinates
x, y = [], []

for xi in np.linspace(2, 7, 50):
    for yi in np.linspace(0, 5, 50):
        x.append(xi)
        y.append(yi)

x, y = np.array(x), np.array(y)
z = np.sin(x) + np.cos(y*x - 5) * np.cos(x) + 2

p = np.column_stack([x, y, z])

t = TIN('Contour', p, grid=10)

t.plot_contour_2d()
(Source code, png, hires.png, pdf)
- ax :