civpy.survey.SpatialHash.plot
-
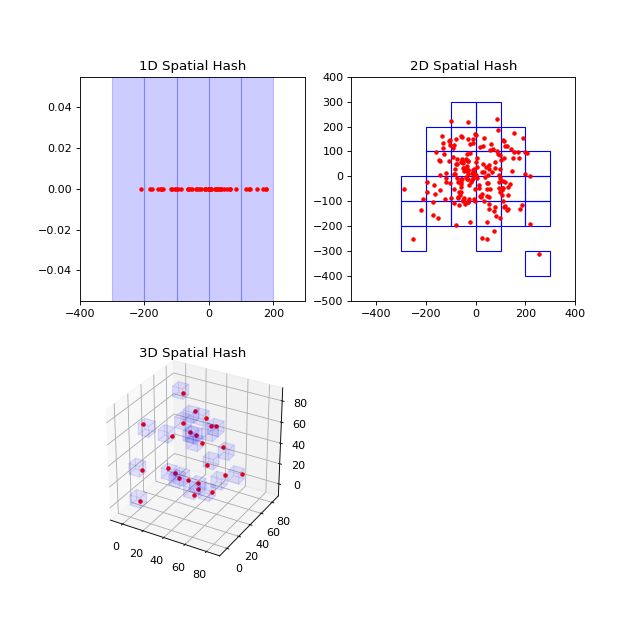
SpatialHash.plot(self, ax=None, symbols={})[source]¶ Creates a plot of the spatial hash. Cannot create plots for hashes greater than 3 dimensions.
Parameters: - ax :
matplotlib.axes.Axes The axes to which the plot will be added. If None, a new figure and axes will be created.
- symbols : dict
A dictionary of plot symbols with any of the following keys:
- points: Point symbols, default is ‘r.’
- hash: Hash region color, default is ‘b’
Examples
# spatial_hash_ex1.py
import numpy as np
import matplotlib.pyplot as plt
from civpy.survey import SpatialHash

fig = plt.figure(figsize=(8, 8))

# 1D Spatial Hash
np.random.seed(138793874)
ax1 = fig.add_subplot(221,
    xlim=(-400, 300)
)
x = np.random.normal(0, 100, (50, 1))
s = SpatialHash(x, 100)
ax = s.plot(ax=ax1)
ax.set_title('1D Spatial Hash')

# 2D Spatial Hash
np.random.seed(53287442)
ax2 = fig.add_subplot(222,
    xlim=(-500, 400),
    ylim=(-500, 400),
    aspect='equal'
)
x = np.random.normal(0, 100, (200, 2))
s = SpatialHash(x, 100)
ax = s.plot(ax=ax2)
ax.set_title('2D Spatial Hash')

# 3D Spatial Hash
np.random.seed(8973489)
ax3 = fig.add_subplot(223,
    projection='3d',
    xlim=(-10, 90),
    ylim=(-10, 90),
    zlim=(-10, 90),
    aspect='equal'
)
x = np.random.uniform(0, 80, (25, 3))
s = SpatialHash(x, 10)
ax = s.plot(ax=ax3)
ax.set_title('3D Spatial Hash')
(Source code, png, hires.png, pdf)
- ax :