civpy.survey.Alignment.plot_plan
-
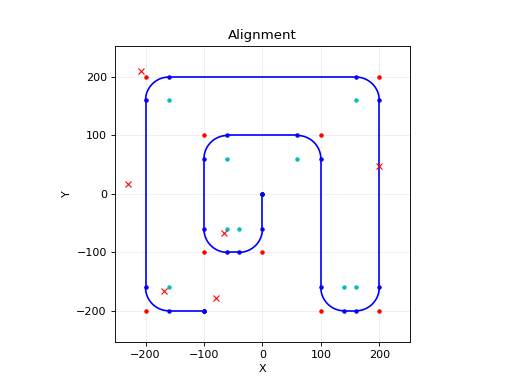
Alignment.plot_plan(self, ax=None, step=1, symbols={})[source]¶ Plots a the plan view for the alignment.
Parameters: - ax :
matplotlib.axes.Axes The axex to which to add the plot. If None, a new figure and axes will be created.
- step : float
The step interval to use for plotting points along horizontal curves.
- symbols : dict
A dictionary of symbols to use for the plot. The following keys are used:
- pi: PI point symbol, default is ‘r.’
- rp: RP point symbol, default is ‘c.’
- pc: PC point symbol, default is ‘b.’
- pt: PT point symbol, default is ‘b.’
- alignment: Alignment lines, default is ‘b-‘
- stakes: Stake symbols, default is ‘rx’
Examples
# alignment_ex1.py
from civpy.survey import PI, Alignment, SurveyStake

# PI coordinates
p = [
    #   x,    y  z,  r
    (-100, -200, 0,  0),
    (-200, -200, 0, 40),
    (-200,  200, 0, 40),
    ( 200,  200, 0, 40),
    ( 200, -200, 0, 40),
    ( 100, -200, 0, 40),
    ( 100,  100, 0, 40),
    (-100,  100, 0, 40),
    (-100, -100, 0, 40),
    (   0, -100, 0, 40),
    (   0,    0, 0,  0)
]

# Stake survey stations
q = [
    # sta, off, z, ht,      rot,
    (   0,  30, 0, 0, -0.78539),
    ( 100,  30, 0, 0,        0),
    ( 300, -30, 0, 0,        0),
    ( 475, -30, 0, 0,        0),
    (1000,   0, 0, 0,        0),
    (1975, -30, 0, 0,        0)
]

p = [PI(*x) for x in p]
q = [SurveyStake.init_station(*x) for x in q]

align = Alignment('Alignment', pis=p, stakes=q)
align.plot_plan()
- ax :